What is a cohort? And why do you want to analyze them?
Google Analytics defines a cohort as a group of people who share a common characteristic or experience within a defined period. For now, most are grouped by when they came to your website.
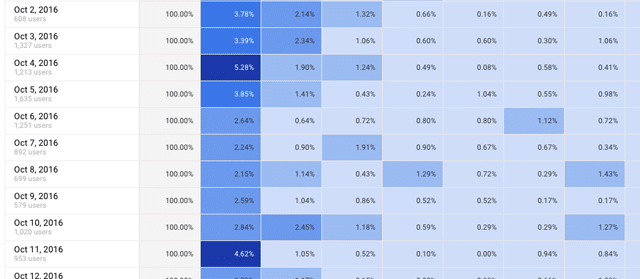
If you are a content-based website the most valuable data is going to be Acquisition by Date. Because you can see what activities that happened a specific day, say when a newsletter goes out, and how the effects your traffic on the continuous days after it was sent. Or when a story drives a lot of traffic and how that lingers for days afterwards.
You should leave the date ranges at seven days. You can go further out if you like but make sure you fully understand seven days and how that impacts your website first.
So what is going on here?
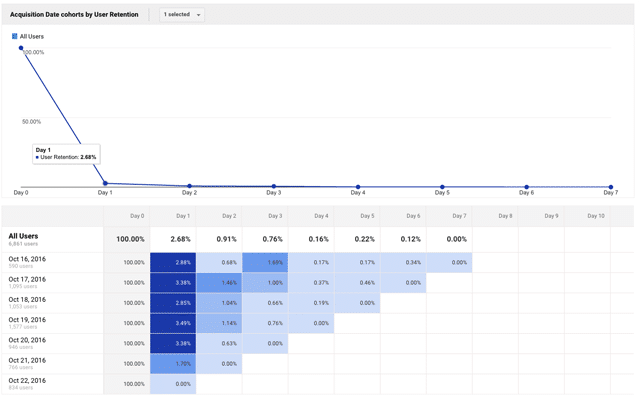
Well, if you look at the day you sent a newsletter, for example, you can start to see how engaged users are when a newsletter is sent, in my example above it was on the 17th and 19th, or other marketing, including posts to social media. Then you can look at trends over the course of 30 days to see whether those who came for one newsletter came back for other days when the newsletter went out.
If you set Cohort Size to Month you can start to see trends for those who came the first time on a day when a newsletter was not released for instance and that they returned on the day it was. See if you can find the patterns below and note the days with higher engagement and the continuation of that for days.